
We know what’s coming and we are prepared.
Here’s a timeline of all 21 U.S. federal government shutdowns since 1976, with dates, duration, presidents, and causes:
⸻
📊 U.S. Government Shutdowns (1976–2019)
1.Sep 30 – Oct 11, 1976 — 10 days — Gerald Ford — Funding dispute over spending cuts
2.Sep 30 – Oct 13, 1977 — 12 days — Jimmy Carter — Abortion funding limits
3.Oct 31 – Nov 9, 1977 — 8 days — Jimmy Carter — Abortion funding limits
4.Nov 30 – Dec 9, 1977 — 8 days — Jimmy Carter — Abortion funding limits
5.Sep 30 – Oct 18, 1978 — 18 days — Jimmy Carter — Defense funding & abortion limits
6.Sep 30 – Oct 12, 1979 — 11 days — Jimmy Carter — Defense spending & abortion funding
7.Nov 20 – Nov 23, 1981 — 2 days — Ronald Reagan — Cuts to defense & domestic spending
8.Sep 30 – Oct 2, 1982 — 1 day — Ronald Reagan — Dispute over MX missile & Nicaraguan aid
9.Dec 17 – Dec 21, 1982 — 3 days — Ronald Reagan — House vs Senate spending differences
10.Nov 10 – Nov 14, 1983 — 3 days — Ronald Reagan — Funding for MX missile
11.Sep 30 – Oct 3, 1984 — 2 days — Ronald Reagan — Disputes over crime bill & water projects
12.Oct 3 – Oct 5, 1984 — 1 day — Ronald Reagan — Continuing disputes from above
13.Oct 16 – Oct 18, 1986 — 1 day — Ronald Reagan — Welfare & water projects
14.Dec 18 – Dec 20, 1987 — 1 day — Ronald Reagan — Contra aid & defense
15.Oct 5 – Oct 9, 1990 — 3 days — George H.W. Bush — Budget deficit reduction & taxes
16.Nov 13 – Nov 19, 1995 — 5 days — Bill Clinton — Medicare, education, environment cuts
17.Dec 15, 1995 – Jan 6, 1996 — 21 days — Bill Clinton — Balanced budget disagreement
18.Sep 30 – Oct 1, 2013 — 16 days — Barack Obama — Affordable Care Act funding (Obamacare)
19.Jan 20 – Jan 22, 2018 — 3 days — Donald Trump — Immigration & DACA
20.Feb 9, 2018 — <1 day — Donald Trump — Budget caps & military funding
21.Dec 22, 2018 – Jan 25, 2019 — 35 days — Donald Trump — Border wall funding
⸻
✅ Total: 21 shutdowns.
⚠️ Longest: 35 days (2018–2019).
⚡ Most shutdowns: During Reagan (8 total, though many were short).
@insiderpaper
Miatta Fanbulleh is Liberian.
She is now in charge of Britain's Energy Security.
Meanwhile this is what Liberia looks like:
Beaches covered in excrement.
No waste management.
Absolute filth.
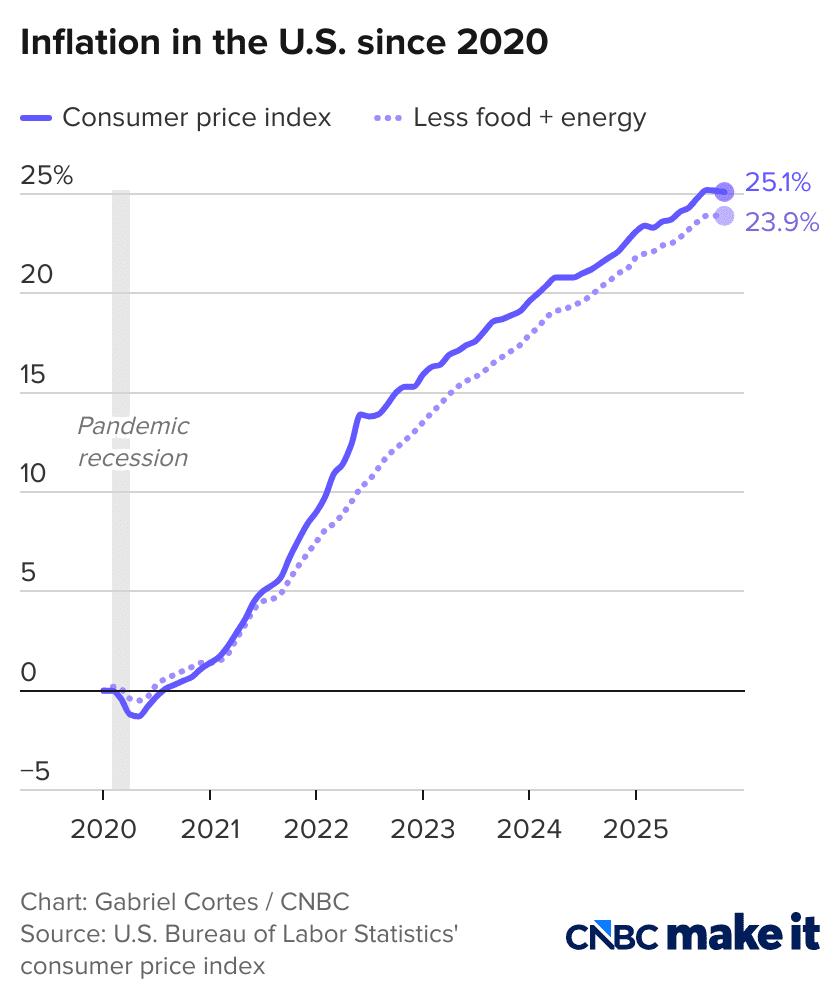
THE COST OF THE AMERICAN DREAM HAS EXPLODED.
-
Owning a home.
-
Buying groceries.
-
Driving to work.
-
Paying insurance.
-
Even your morning coffee.
Nearly every major household expense costs dramatically more than it did just a few years ago.
Over the last 7 years:
• Coffee: +127%
• Home prices: +60%
• Auto insurance: +51%
• Gasoline: +49%
• Electricity: +44%
• Shelter: +35%
• Groceries: +33%
And that's before paying for healthcare, transportation, or eating out.
This is why so many families feel like they're falling behind even when they get a raise.
The biggest financial problem for millions of Americans is that everything is going up at the same time, while the government keeps showing a 2% inflation target.
🄳🄾🄾🄼🄿🤖🅂🅃🄸🄽🄶
Biohacker Bryan Johnson claimed he cloned himself as a newborn for the purpose of providing him blood and cells.